From Linear to Spatial – See, Solve, and Communicate the Complex Faster

The world is dynamic.  Complex problems and intricate processes can rarely be conveyed in simple narratives, solved with simple logic or bursts of unbridled brainstorming.

Graphic processes harness this dynamic energy through Whole-Brain thinking – Combining the strengths of both left-brain-analytical and right-brain-creative processes. Pictures show spatial relationships, links and overlaps difficult to explain with words or formulas alone. Capturing creative ideas on paper can anchor concepts, foster objective analysis and clarify plans and actions.

Best of all, graphics engage, entertain and create memorable and energizing experiences for work groups and audiences.
What Graphics Can Do

INCREASE PRODUCTIVITY

• Visual processes increase group consensus by 21%
• Improve problem-solving effectiveness by 19% when you use visual processes.
• People are more engaged in graphic meetings and collaborate better, even when the topic is tough.
• 50% of your brain is activated in visual processing, more if text is included.

SHORTEN MEETINGS

• Visual language shortens meetings by 24%.
• Graphic meetings produce 22% more outputs in 13% less time.
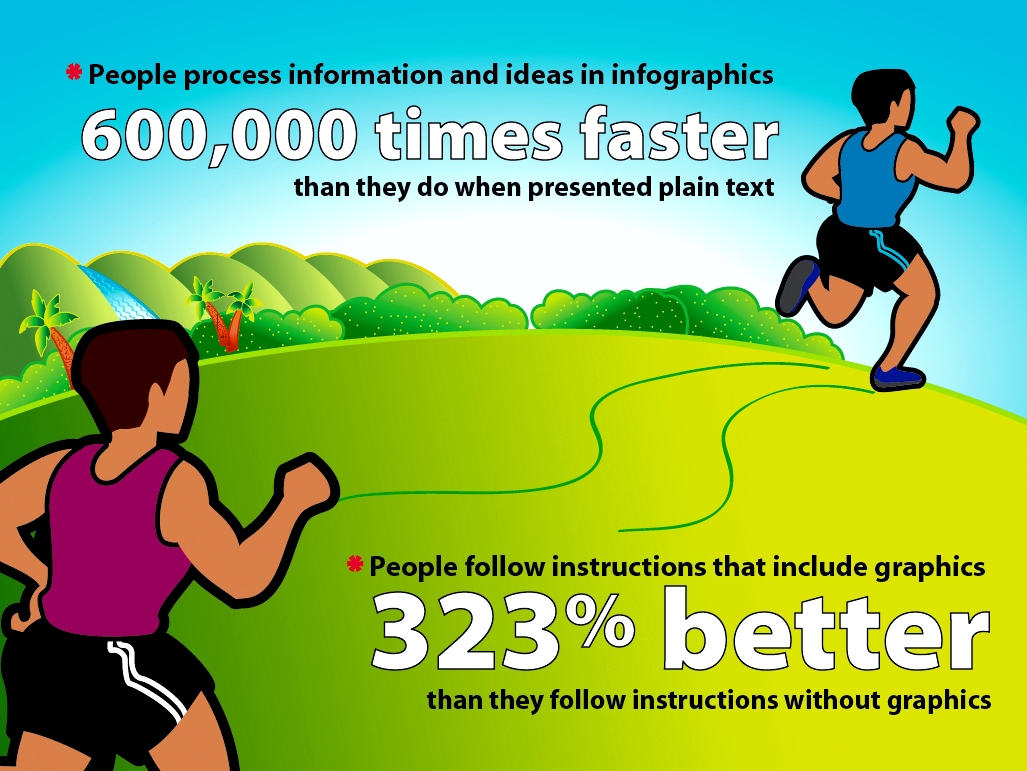
• Our brains process visual information 600,000 times faster than with text alone.

PRESENT BRILLIANTLY

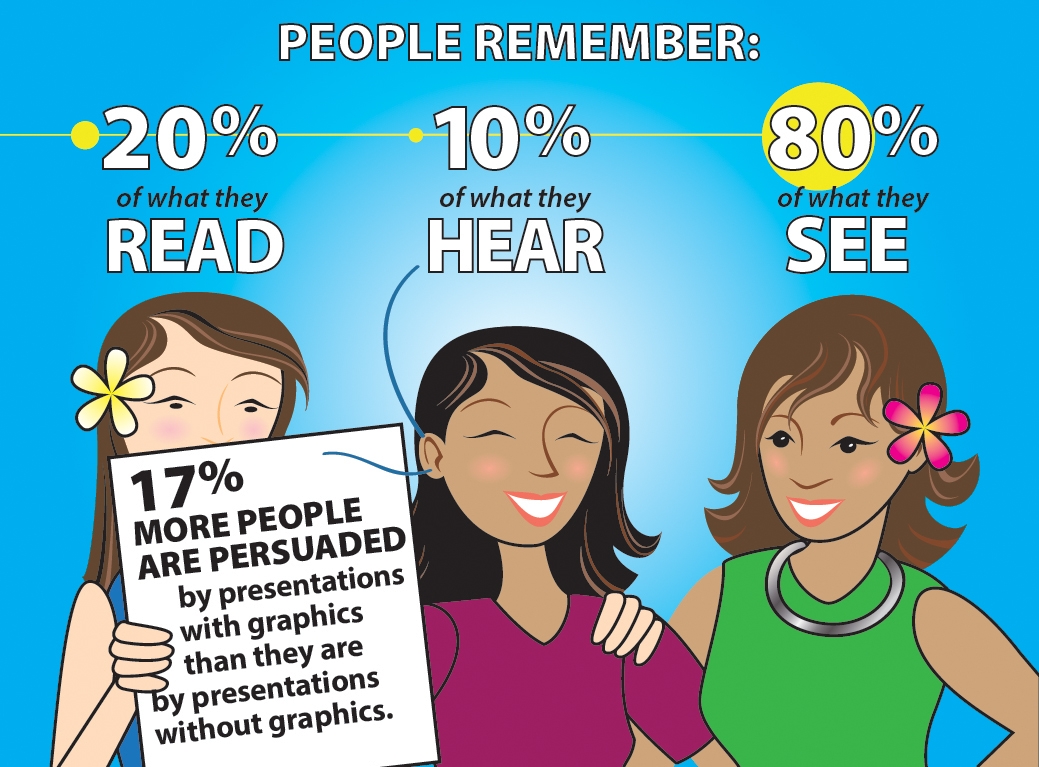
• Graphic presentations are 43% more persuasive.
• People follow illustrated instructions 323% better than text alone.

• A Dartmouth study showed people are more likely to accept information that “disconfirmed” their beliefs and were less likely to argue when show a graphic line chart vs. a text based chart.
• 95% of marketers agree visuals are more persuasive than text.

BE ENGAGING

• 65% of the population are visual learners.
• Color visuals increase peoples willingness to read by 80%.
• People like posts with images 200% more than those without.
• Posts that include images produce 650 percent higher engagement than text-only posts.
• Graphics draw attention to the page, people stay engaged and entertained, even when the work or message is difficult.

BE REMEMBERED

• Graphics make text 70% more memorable.
• Graphic presentations are 600% more memorable.

Infographics help comprehension
Infographics are remembered